It is common knowledge that Southern California has Real Estate cycles. Often very dramatic boom & bust cycles. In 2017, many homeowners started getting nervous that the market felt “Toppy”. In response to this sentiment I dove deep into the market and wrote “A Top is NOT in sight…”. This article is available on our website at www.LBRE.com/2017news.
My assessment was that home prices were still fairly valued, there was little inventory on the market and I saw no correction or market top in sight, despite being 6 years into a recovery from 2011’s market bottom. I further stated, “I believe the biggest threat to housing is a sudden increase in interest rates.”
Being Able to Predict Prices – Is it Possible?
While being able to predict prices in the stock market seems near impossible, the Real Estate market to me seems more predictable. While billions of dollars of stocks can sell in milliseconds at the press of a button, Real Estate is a slow moving animal with what seems like more predictable long term trends.
Just look at the last 6 months of the stock market. There was 20% correction, followed immediately by a retracement of these losses with the stock market back and testing new highs. Real Estate doesn’t move that fast.
Market Top – What Signs to Look For?
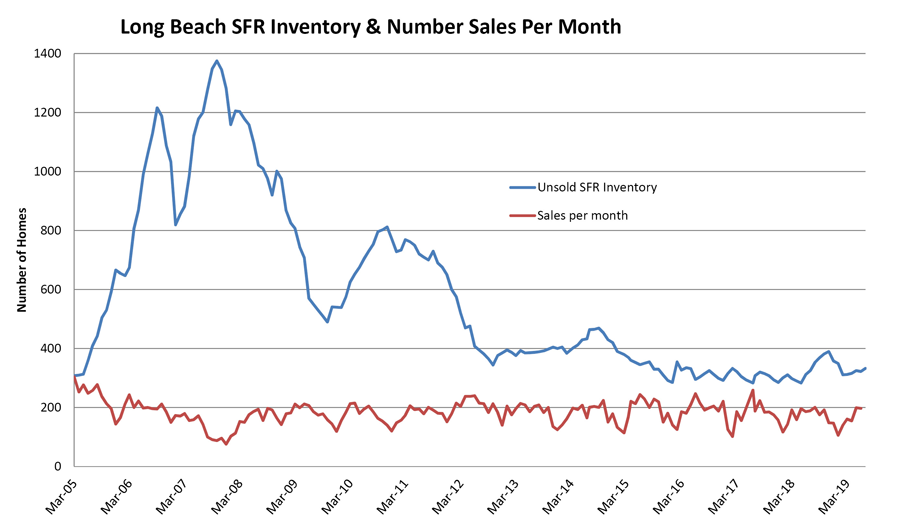
To state the obvious, what moves price is supply and demand. For this reason my “Go To” statistic has been the number of months supply of homes. This is simply how many homes are currently for sale in Long Beach, divided by how many homes sell per month. This has proven to be a very reliable indicator. More importantly, it has proven to be a leading indicator because inventory builds in advance of price declines.
Digging Deeper
Late last year when the Fed started raising interest rates and promised more on the horizon, the market started to slow. Buyers were not too happy with paying more for a home and being hit with higher payments due to rate increases.
Since last years interest rate hikes, it looked like the Real Estate market might stall. Certainly the stock market was not excited about the prospects of a hawkish Federal Reserve, and showed it’s displeasure with a 20% correction into bear market territory.
On a weekly basis I had been checking the inventory of unsold homes in Long Beach looking for some indication of a slowing market. Contrary to a sense that the market was slowing, I did not see inventory increasing. So this last month, I spent hours pouring over 20 years of sales data, looking for clues.
Being a Statistics Wonk
I will digress here and talk about my love of numbers. I even love quotes about numbers, like…. “There are liars, damn liars, and then there are statisticians.” or “A set of numbers will submit to anything if tortured long enough”. What these quotes warn against is somebody with an agenda that uses statistics to back up their claim. I ventured into the analysis to look for signs of a slowing market and I believe I have found some valid numbers. In addition, I put these number in context with current market and historical comparisons. I will share some new observations with you and let you be the judge and to the state of the market.
20 Years of Sales Data from Zip Codes 90808 & 90815
In search of answers I compiled all home sales from zip codes 90808 & 90815 during the last 20 years. I chose 90808 and 90815 as a data pool because the neighborhoods are vary homogeneous and therefore will produce statistically consistent results. There are also enough data points, as there are between 600 and 1100 sales each year in these two zip codes.
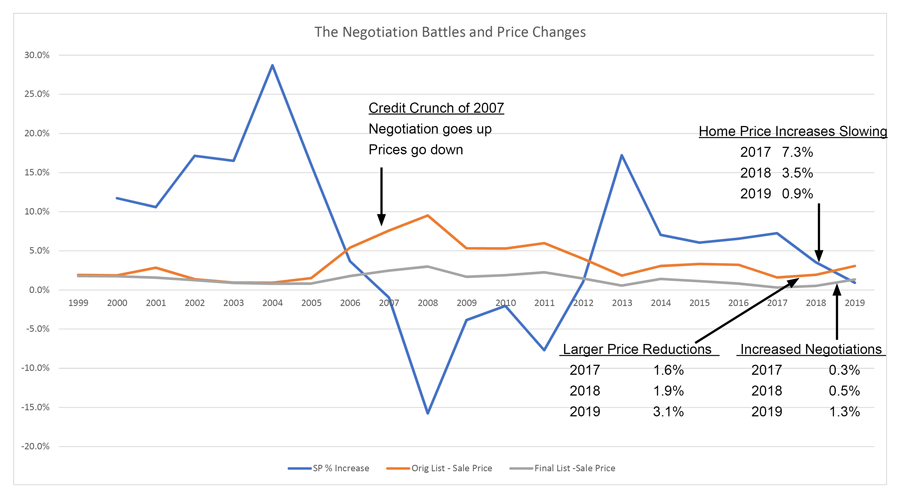
The new statistics that I have compiled are represented by three graphs. The Orange Line represents the sellers optimism when first listing their home. It is the percentage difference between the sellers Original List Price and the Actual Sales Price.
The Gray line shows how much the buyer and seller negotiated. It is the difference between the Final List Price that caused a buyer to make an offer and the Actual Sales price. The Blue Line is the year to year price percentage change as the result of these negotiations.
Our current numbers for 2019 are as follows. The average Original List Price for homes in 90808 & 90815 was $764,000 while the average Actual Sales Price was $741,200, but the average seller needed a price change to $751,100 (Final List Price) before the home went into escrow.
This may sound a little confusing at first because we are talking about averages, so lets talk about two different scenarios. Seller “A” lists his home accurately and sells without any prices changes and minimal negotiation. While seller “B” lists his home for more than $20,000 over the home’s value. Overpriced Seller “B’s” home then sits on the market X days before a price drop. Most homes in 90808 & 90815 will not sell if the list price is more than $20,000 over the price a buyer is willing to pay, so seller “B” may drop the price several times. The Orange datat line is the difference between the average original list price and average sales price. The gray data line is the difference between the final list price and the sales price. In the case of Seller A, his original list price is his final list, as seller A didn’t need a price change.
The end result is the Blue line which shows the percentage increase or decrease in home prices, year over year.
Observations
Looking at the Blue line (% price change year over year), we can see the market bottomed in 2011. In 2012 there was finally a small 1% price increase, and then a whopping 17.2% price increase in 2013. Since that time, price increases have been slowing from a solid 7.3% gain in 2017, a small 3.5% gain in 2018, and a barely there gain of 0.9% for 2019. Of course 2019 is not over, but with current trends price increases are not guaranteed.
Now looking at the buyers ability to negotiate, we see that buyers are becoming more reluctant to pay full list price. During 2016, 17 & 18, buyers only negotiated about one half of one percent off list price. If the average home was $750,000, then they paid within $4,000 of list on average. Buyers had very little negotiating power during this time frame.
In contrast, buyers are now negotiating 1.3% or around $10,000 off list after the average seller has already dropped their list price $13,000. This by itself is NOT a big deal. What is a big deal is that price increases seem to be running out of steam and a buyers ability to negotiate may exceed a sellers ability to raise their home value. This subtle balance of power may indicate that the market has reached a temporary top.
What My Old Metric Says
What I like about my old metric (Months Supply of Inventory) is that it is a leading indicator. Inventory piling up and sales volume dropping actually FORECASTED lower prices before they occurred. Having foresight can put you months ahead of price action. My new metric of who is winning the negotiation battle is based upon closed sales prices, which is a trailing indictor.
The Inventory vs. Sales graph (posted on our website version of this article) shows nothing like the dramatic run up of inventory into the August 2007 credit crunch. There is one observation that is worth noting. Sales volume through 2014 – 2017 always crested over 200 sales per month at some point in the year, with 220 – 250 sales per month being regular occurrences. In 2018, sales did not exceed 200 per month. Consequently, peak volume is down 20% from 2014-2017. While there has been a reduction in the number of sales there has not been a significant corresponding increase in inventory, so it seems my old metric is still saying the market is neutral. But in the world of statistical analysis final price action is supreme and right now price analysis indicates the market has turned flat.
If the Real Estate Market is at a Top, What Will the Other Side Look like?
When anticipating the markets next move, I will first consider whether the market is overvalued. If the market is fairly valued, then a slow down may just be that, the market slows. If the market is wildly overvalued, then there is much more risk headed into this shift in direction.
Overvalued / Undervalued Model
The phrase “The bigger they are the harder they fall” can relate to the Real Estate market and is always my concern. When home prices seem very lofty then they potentially have farther to fall. This is NOT THE CASE RIGHT NOW. Home prices, from my metric, are fairly valued. In 1990 my valuation showed homes to be 25% over priced and in 2006, homes were 40% overvalued. Today they are fairly valued.
My simple model compares a homes total payment with 10% down to current rent rates. I multiply the home payment, which has huge tax advantages, by 75% when comparing it to rent, which offers no tax advantages, making the comparison fair.
The payment for the average 90808 / 90815 home at a 4.25% rate would be $4,200. Multiplying this by 75% gets me a rental equivalent of $3,150 per month. This average home would be a 3 bedroom, 2 bath home with around 1,600sf. Often times this metric shows homes to be slightly overvalued. I believe this is a fair market bias, with the benefits of home ownership outweighing renting. At market bottoms this metric has never shown homes to be more than 10% undervalued, and when undervaluation occurs it is usually at the bottom of the market and only occurs for a very brief time.
Which Leads Us Back to Interest Rates
In previous articles, I cited how a change of 1 percentage point on a buyers mortgage interest rate, raises or lowers their payment by around 10%. During the previous bull phase of the Real Estate market from 1995 – 2006, we had continuously lower interest rates to help power prices forward.
Today we don’t. In late 2018, interest rates jumped significantly and the Federal Reserve postured that more rate hikes where on the horizon. Subsequently, the stock market quickly crashed 20% and the Federal Reserve backed off their hawkish stance and rates came down.
My overall assessment is that we are likely going to be at a plateau for a while. Trends that are in place stay in place, and I think this most recent upward price trend from 2011 to 2018 may be coming to an end in 2019. What will replace it? I do not think we will have some big price retracement. Home prices are not overvalued, nor is there a build up of inventory.
What will likely replace this market is a more normal market that many other parts of the country experience. A slow upward creep of prices, held in check by cautious buyers with some negotiation power. This is how Real Estate prices move in most parts of the country. Imagine California Real Estate with out the boom and bust. That is almost boring…. at least we still have earthquakes!
Market Moves will be Subtle
Previous upward price trends have been more dramatic, leading to significant over valuations and over corrections. The recovery from our recent market bottom of 2011 has been more rational and reserved. Today’s bull market recovery has been very mild and now as the market shifts, it is one of different shades of gray. Not from full throttle to full brakes. More just a lifting of the accelerator pedal.
We are in a period of slowing appreciation, to a level of potentially less than 3% price growth per year, and it may be within buyers negotiating power to keep this growth at bay.
However, buyers should not necessarily wait to buy. With valuations favorable, relative to rent, expecting big discounts into the future would not be something I would bet on.